Multi-Criteria Analysis (MCA)

Multi-criteria analysis (MCA) is a class of procedures designed to aid decision-making where options are evaluated based on more than one criterion, in particular where these criteria are measured in different units which can not be readily converted into each other. Many different MCA procedures exist, but all are based on the principles of data normalization and of assigning weights to the different criteria in order to arrive at an integrated score for each option. 


MCA procedures are very useful in multifunctional disciplines such as agriculture, where all management choices have multiple effects and involve trade-offs within and between the social, economic and environmental spheres. 

Multi-criteria analysis (MCA) is a structured procedure to compare and rank options while considering more than one criterion. This is achieved by normalizing all quantitative and/or qualitative information about an option, assigning weights to all criteria, and then combining the information into a single, integrated value. Multi-criteria analysis is a tool for dealing with the inevitable trade-offs within complex decision-making situations, which may also feature high uncertainty, different forms of information, and multiple stakeholder interests and perspectives. For this reason, MCA has gained momentum as a methodology for the evaluation of sustainability (Adams & Ghaly, 2007). In the context of impact assessments, multi-criteria analysis can be used at the end of the research to combine the indicator values of multiple impact areas into integrated results and to rank the investigated management options.


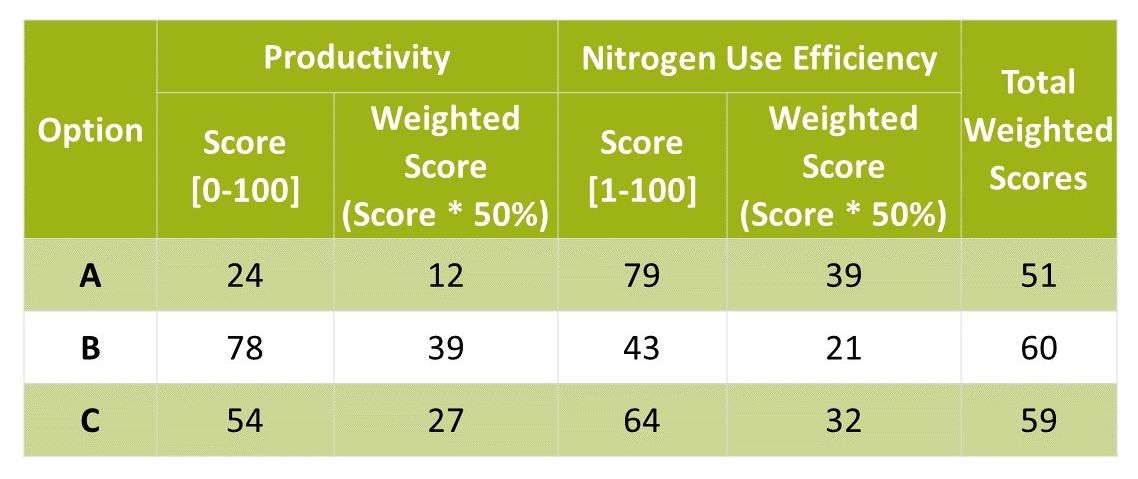
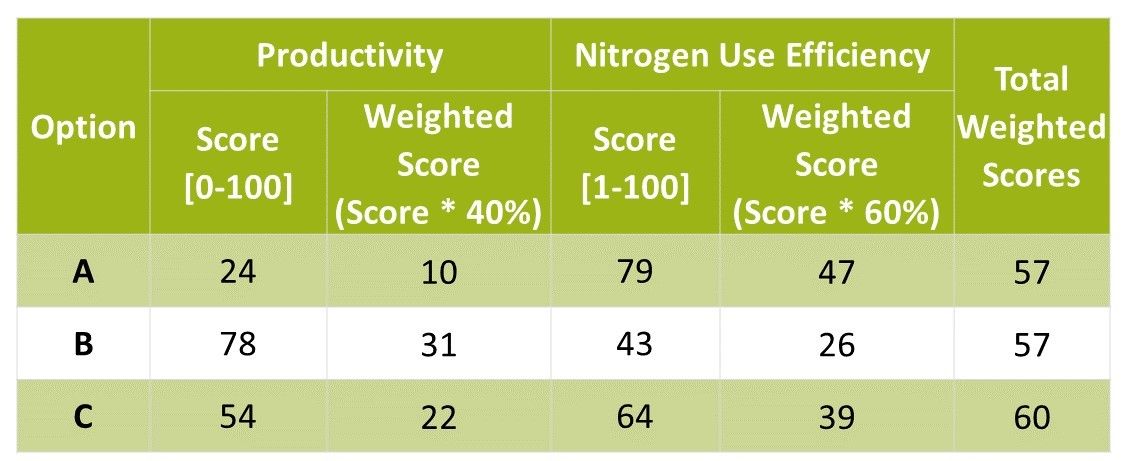
Multi-criteria problems are common occurrences. For example, a farmer’s decision over which crops to plant may depend on factors such as expected revenues, risk of crop failure, time requirements, or personal preferences. Weighing them against each other in order to find the optimal solution is difficult because factors are assessed in different units that can not objectively be converted into each other (e.g., how much additional revenue would exactly balance a higher risk of crop failure or a reduction in spare time?). These decisions always involve an element of normative valuation. Usually, they are made intuitively based on previous experience. In impact assessments, however, a structured approach is required to avoid subjectivity, guarantee transparency, and to address problems that are too complex to solve intuitively. Multi-criteria analysis facilitates this by providing a method to combine scientific assessments with normative value choices. Indicator values from different impact areas are first normalized to a common, dimensionless scale and then weights are assigned, based on the perceived importance of the impact area for the respective assessment. This second step is purely normative and should ideally be based on stakeholder involvement or on societal norms codified in laws or regulations. Because normative decisions are always subjective and the weights assigned may not be reproducible with a different set of stakeholders or with the same set of stakeholders at another time, it is very important to document how decision makers or stakeholder groups were selected, or by what method weights were derived from laws or regulations. Finally, for each option analysed in the assessment, the normalized indicator values representing an impact area are multiplied by the weights assigned to that area and all products are summed up to generate a total, integrated score. If the impact assessment investigated different options, they may then be ranked based on the integrated score. 

Sustainability impact assessment is characterized by investigating multiple impact areas related to the economic, ecological and social dimension. The findings for each impact area will be represented by an indicator that comes in a specific unit, such as “number of ground-nesting bird species” or “tons of wheat”, which can not be easily converted into a common unit. However, to rank options and to decide which management is the most sustainable, exactly that is needed. Multi- criteria analysis provides a structured and transparent way to achieve integration of assessment results. MCA is particularly useful with regard to assessments of agricultural management, where management choices have multiple effects and usually involve trade-offs.

To explain the application of a multi-criteria analysis, we use a simplified example where a farmer needs to choose between three alternative fertilisation options and where only two impact areas from the perspective of resource use efficiency are assessed: productivity, measured as harvested ton of wheat per hectare, and nitrogen use efficiency (NUE), measured as kilogram nitrogen taken up by the crop per kilogram of nitrogen applied as fertilizer. 


• Option A: Low fertiliser application rate  

• Option B: High fertiliser application rate

• Option C: Intermediate fertiliser application rate


Table 11 shows hypothetical values for productivity and nitrogen use efficiency for each of the options. 

Table 11: Hypothetical values for productivity and nitrogen use efficiency resulting from three fertilization intensities.

Table 11: Hypothetical values for productivity and nitrogen use efficiency resulting from three fertilization intensities.

Table 11: Hypothetical values for productivity and nitrogen use efficiency resulting from three fertilization intensities.

Step 1 - Normalizing indicator values

The first step of the multi-criteria analysis is to convert all indicator values onto a numerical (dimensionless) scale to enable direct comparison. One approach often used is to allot scores between 0 and 100, with 100 representing the best possible result within the respective category and 0 representing the worst (Dodgson et al., 2009). Where a large number of options are compared, transformation into z-scores is also possible.


It is crucial to the validity of the MCA result that scores are determined as objectively as possible. For the current example, it is assumed that a productivity between a maximum of 10 t/ha and a minimum of 2 t/ha could normally be expected. A maximum score of 100 is therefore assigned to yields of 10 t/ha (or more) and a minimum score of 0 is assigned to yields of 2 t/ha (or less). Intermediate values are given proportionate scores along the scale. For nitrogen use efficiency, a maximum of 80% and a minimum 10% is assumed. The table below shows the resulting scores for each option.

Table 12: Hypothetical scores for productivity and nitrogen use efficiency resulting from three fertilization intensities.

Table 12: Hypothetical scores for productivity and nitrogen use efficiency resulting from three fertilization intensities.

Table 12: Hypothetical scores for productivity and nitrogen use efficiency resulting from three fertilization intensities.

Step 2 - Assigning weights to each impact area and multiplying with scores


Once values have been converted onto a comparable numerical scale, the next step is to assign weights to the impact areas that represent their relative importance. For example, the farmer could decide to value both criteria equally (50/50) or put stronger emphasis on either productivity or nitrogen use efficiency (e.g., 60/40).


Step 3 - Calculating integrated scores and final assessment


Weighted scores are calculated by multiplying the score of an impact area with the weight it has been assigned. All weighted scores of an option are then summed up to create a total, integrated score. By comparing these integrated scores, a ranking can be achieved and the best option can be identified.


For example, if productivity and nitrogen use efficiency are considered by the farmer to have equal importance (50% each), Option B achieves the best outcome with a total score of 60, closely followed by option C with a total score of 59 (see Table 10).


Table 13: Calculation of integrated scores based on productivity and nitrogen use efficiency for an example of three fertilization intensities. A weighting of productivity: 50% and nitrogen use efficiency: 50% is assumed.  Option Productivity Nitrogen Use Efficiency Total Weighted Scores Score [0-100] Weighted Score

Table 13: Calculation of integrated scores based on productivity and nitrogen use efficiency for an example of three fertilization intensities.

Table 13: Calculation of integrated scores based on productivity and nitrogen use efficiency for an example of three fertilization intensities.

Table 13: Calculation of integrated scores based on productivity and nitrogen use efficiency for an example of three fertilization intensities.

If the farmer considers nutrient use efficiency to be more important and assigns a weight of 40% to productivity and a weight of 60% to nitrogen use efficiency, the best outcome is achieved by option C (see Table 11).


Table 14: Calculation of integrated scores based on productivity and nitrogen use efficiency for an example of three fertilization intensities. A weighting of productivity: 40% and nitrogen use efficiency: 60% is assumed.

Option Productivity Nitrogen Use Efficiency Total Weighted Scores Score [0-100] Weighted Score

Table 14: Calculation of integrated scores based on productivity and nitrogen use efficiency for an example of three fertilization intensities.

Table 14: Calculation of integrated scores based on productivity and nitrogen use efficiency for an example of three fertilization intensities.

Table 14: Calculation of integrated scores based on productivity and nitrogen use efficiency for an example of three fertilization intensities.

Obviously, which option is considered to achieve the best outcome is strongly dependent on the weights assigned to each impact area. The weighing process is inherently subjective and only has a limited precision. Where options achieve very similar integrated scores, it is therefore practical to consider their outcomes to be equal. In our example where productivity and nitrogen use efficiency were assigned equal weights, options B & C could therefore be considered to have the same merit (scores of 69 and 60).


In the interest of transparency, it is important to explain the reason for the assigned weights. This includes documenting if decision makers or larger groups of stakeholders were involved, what criteria were used for their selection and what methods were applied for arriving at the final weighting. Please consider that the assigning of equal weights for all impact areas is also a normative decision that has a strong influence on the final assessment results.

Adams M A, Ghaly A E. 2007. The foundations of a multi-criteria evaluation methodology for assessing sustainability. The International Journal of Sustainable Development & World Ecology, 14(5), 437–­449. DOI:10.1080/13504500709469744


Dodgson, J. S., Spackman, M., Pearman, A., & Phillips, L. D. (2009). Multi-criteria analysis: a manual. Communities and Local Government Publications, Wetherby, U.K., 165 pp. ISBN: 978-1-4098-1023-0